A brief introduction to IPython magic commands and other utilities to profile Python code.
While developing with Python, often we have the need for testing different algorithm implementations to ensure they are efficient in both time and space to meet your business requirements.

There are many tools in the Python world to do this but I’m personally a big fan of using IPython and just test my code on the REPL because this allows me to iterate fast and
there are several IPython native magic commands and others that can be added with extensions which makes
timing and profiling an effortless task. In this post, I will introduce how to use the following IPython
magic functions and other tricks that I generally use on my workflow:
-
%time & %timeit: Measure how long a piece of code takes to run (single statement, or average over several runs). -
%prun: Measure how long takes each function call on a piece of code. -
%lprun: Measure how long it takes each line in a piece of code. -
%mprun & %memit: Measure how much memory a piece of code uses (line-by-line, or average over several runs).
Package requirements
First, we need to have IPython itself installed:
$ pip install ipython
$ ipython --version
6.4.0
IPython alone comes with some functionality for profiling, but I use the following packages to have more superpowers on it:
$ pip install matplotlib
$ pip install simple_benchmark
$ pip install line-profiler
$ pip install psutil
$ pip install memory_profiler
To activate the magic functions from line-profiler and memory_profiler when IPython starts, you will need to create a configuration profile with ipython profile create that generates a file in ~/.ipython/profile_default/ipython_config.py. Edit this file and add the following at the end of it:
c.InteractiveShellApp.extensions = [
    'line_profiler',
    'memory_profiler',
]
Now is time to launch IPython and start profiling our code. Note that magic functions can be used with the % prefix for single lines and %% for multi-line runs.
Measuring time
Now we will see how to measure how long a piece of code takes to execute using the %time and %timeit:
%time
In [1]: %time sum(range(1000))
CPU times: user 46 µs, sys: 0 ns, total: 46 µs
Wall time: 52 µs
Out[1]: 499500
%timeit
In [1]: %timeit sum(range(1000))
23.4 µs ± 915 ns per loop (mean ± std. dev. of 7 runs, 10000 loops each)
The number of runs can be set with the parameter -n N, which will limit %timeit to N iterations, like this:
In [1]: %timeit -n sum(range(1000))
23.4 µs ± 915 ns per loop (mean ± std. dev. of 7 runs, 10000 loops each)
Profiling code execution
Now I will show how to profile how long each function call takes in a piece of code, using %prun and how long it takes line-by-line, using %lprun.
%prun
This command is especially useful to measure different calls inside a piece of code, we will use the following silly code to illustrate how it works:
from random import randint
from time import sleep

def sum_number(n: int, number: int) -> int:
    """Sums `n` and `number`."""
    return n + number

def print_value(n: int) -> str:
    """Prints the number."""
    print(f'The value is: {n}')

def random_value():
    """
    Generates a random number sums 25 to it,
    sleeps and prints the final value.
    """
    x = randint(0, 100)
    y = sum_number(x, 25)
    sleep(1)
    print_value(y)
In [28]: %prun random_value()
The value is: 50
13 function calls in 1.000 seconds
Ordered by: internal time
ncalls tottime percall cumtime percall filename:lineno(function)
1 1.000 1.000 1.000 1.000 {built-in method time.sleep}
1 0.000 0.000 0.000 0.000 {built-in method builtins.print}
1 0.000 0.000 1.000 1.000 {built-in method builtins.exec}
1 0.000 0.000 1.000 1.000 <ipython-input-27-5aac924200be>:10(random_value)
1 0.000 0.000 0.000 0.000 <ipython-input-27-5aac924200be>:7(print_value)
1 0.000 0.000 0.000 0.000 random.py:223(_randbelow)
1 0.000 0.000 0.000 0.000 random.py:173(randrange)
1 0.000 0.000 0.000 0.000 {method 'bit_length' of 'int' objects}
1 0.000 0.000 0.000 0.000 random.py:217(randint)
1 0.000 0.000 0.000 0.000 {method 'getrandbits' of '_random.Random' objects}
1 0.000 0.000 0.000 0.000 <ipython-input-27-5aac924200be>:4(sum_x)
1 0.000 0.000 0.000 0.000 {method 'disable' of '_lsprof.Profiler' objects}
1 0.000 0.000 1.000 1.000 <string>:1(<module>)%lprun
Will take the following hypotetical piece of code and see how it is performing line by line:
def fib(n: int) -> int:
    """Computes the Fibonacci number of `n`."""
    if n <= 0:
        return 0
    elif n ==1:
        return 1
    return fib(n -1) + fib(n - 2)
The %lprun command takes a -f method_name parameter with the method that we want to profile, before the actual call:
In [1]: %lprun -f fib fib(10)
Timer unit: 1e-06 s

Total time: 0.00026 s
File: <ipython-input-16-5137e9254276>
Function: fib at line 1

Line #      Hits         Time  Per Hit   % Time  Line Contents
==============================================================
     1                                           def fib(n:int) -> int:
     2       177        100.0      0.6     38.5      if n <= 0:
     3        34         13.0      0.4      5.0          return 0
     4       143         63.0      0.4     24.2      elif n ==1:
     5        55         24.0      0.4      9.2          return 1
     6        88         60.0      0.7     23.1      return fib(n -1) + fib(n - 2)
Profiling memory
Profiling execution time is not the only measure we need to make sure our programs are efficient, the space efficiency is something that we need to care about to ensure that our program will not crash due to insufficient memory. The memory_profiler package provides two handy commands to use in IPython that allows us to fight those memory dragons.
Will use the following function that consumes some memory and we will profile it:
from typing import List

def memory_heavy_fun() -> List[int]:
    """Silly function that consumes and gc some memory."""
    a = [1] * (10 ** 6)
    b = [2] * (2 * 10 ** 7)
    del b
    return a
%memit
In [1]: %memit memory_heavy_fun()
peak memory: 100.08 MiB, increment: 61.36 MiB
As you can note, the function above consumes 100.08 MB of memory.
%mprun
With %mprun we can see which lines are consuming the more memory. One thing to note is that this command takes only a function defined in physical files and we need to import it or as a hack one can use the %%file command to define a separate module:
In [1]: %%file blogpost.py
   ...: from typing import List
   ...:
   ...: def memory_heavy_fun() -> List[int]:
   ...:     """Silly function that consumes and gc some memory."""
   ...:     a = [1] * (10 ** 6)
   ...:     b = [2] * (2 * 10 ** 7)
   ...:     del b
   ...:     return a
Writing blogpost.py
We can now profile memory line-by-line like:
In [1]: from blogpost import memory_heavy_fun
In [2]: %mprun -f memory_heavy_fun memory_heavy_fun()
Filename: /Users/codeadict/dev/GooeeIOT/cloud-api/blogpost.py

Line #    Mem usage    Increment   Line Contents
================================================
     3     44.0 MiB     44.0 MiB   def memory_heavy_fun() -> List[int]:
     4                                 """Silly function that consumes and gc some memory."""
     5     44.0 MiB      0.0 MiB       a = [1] * (10 ** 6)
     6    196.6 MiB    152.6 MiB       b = [2] * (2 * 10 ** 7)
     7     44.0 MiB   -152.6 MiB       del b
     8     44.0 MiB      0.0 MiB       return a
Comparing several implementations
In some cases, we come with more than one solution to an algorithm and want to know which one is the most performant based on several runs.
Let’s say we have an algorithm that returns a generator with pairs of n items from a given list of integers and fills the last value with default in case the length of the list is an odd number. You create this first algorithm:
from typing import List, Any

def groups_of_n1(arr: List[int], n: int=2, default: Any=None):
    """
    Group a list of integers on groups of `n` elements and
    fill with `default` for odd lists. Kids don't try this
    implementation at home, is not really performant.
    """
    i = iter(list)
    while True:
        t = tuple(next(i) for _ in range(n))
        if not t:
            break
        yield t + (default,) * (n - len(t))
Then you come up with a second solution:
import itertools
from typing import List, Any

def groups_of_n2(arr: List[int], n: int=2, default: Any=None):
    """
    Group a list of integers on groups of `n` elements and fill
    with `default` for odd lists.
    """
    return itertools.zip_longest(*[iter(arr)]*n, fillvalue=default)
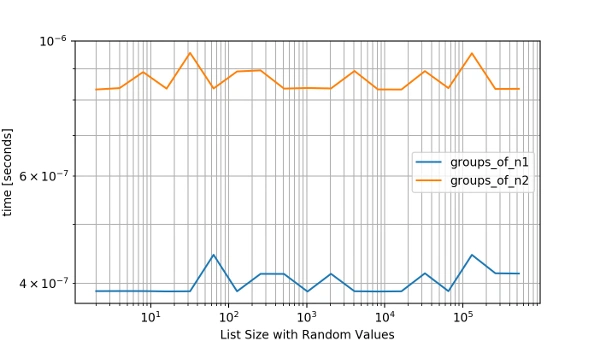
While you can time these algorithms you really want to see how they behave with different values and over several runs because a simple timing measure is not enough to cover all the cases and you need to also show the results to your team. This is when the simple_benchmark package can be really handy. It provides a benchmark method that you can read about in the documentation: http://simple-benchmark.readthedocs.io/en/latest/#simple_benchmark.benchmark. Let’s see how it works with the above functions:
from simple_benchmark import benchmark

# The functions to benchmark.
funcs = [groups_of_n1, groups_of_n2]
# Arguments to pass as a dict of {lenght: list_of_values}.
arguments = {
    2**i: [random.randint(0, 2**(i-1)) for _ in range(2**i)]
    for i in range(1, 20)
}
# Description of the arguments.
arguments_description = 'List Size with Random Values'

# Run the benchmark.
b = benchmark(funcs, arguments, arguments_description)

# Show the benchmark results with matplotlib.
b.plot()
Now we get this nice plot of both functions performance with several inputs where we can notice the second implementation surpassing the first one:
In a next post, I will write about my approach to profile and optimize apps written in Django. Would love to hear about your tips and trick in the comments below!