On how to monitor the VerneMQ message broker using AWS CloudWatch.
Monitoring your systems is very important for production environments. When deploying a MQTT broker or a cluster of MQTT brokers, the DevOps team needs to know the health of the MQTT servers and uses monitoring data to prevent future problems or plan scaling. I ocassionally contribute to the VerneMQ project and while it comes with a few monitoring option by default, still lacks for some tooling for cloud platforms like AWS.
I’m releasing this plugin vmq_cloudwatch_metrics that allows to report the VerneMQ metrics to AWS CloudWatch. Make sure to not report data too often to reduce the prices, make sure to look at pricing page for the current prices and adjust the reporting interval. Note that this plugin has been only tested with Erlang/OTP 19.x and 20.x and it only works with VerneMQ version 1.4.0 or superior.
How to compile this plugin
This project uses Rebar3 as a build tool and can be compiled running:
rebar3 compileHow to enable the plugin on VerneMQ
Manual way using the commandline:
vmq-admin plugin enable --name=vmq_cloudwatch_metrics \
    --path=<PathToYourPlugin>/_build/default/lib/vmq_cloudwatch_metrics
Permanent way in the configuration settings:
Add the following to the vernemq.conf file.
plugins.vmq_cloudwatch_metrics = on
plugins.vmq_cloudwatch_metrics.path = <PathToYourPlugin>/_build/default/lib/vmq_cloudwatch_metrics
Configuration
The following settings are available for this plugin:
-
vmq_cloudwatch_metrics.cloudwatch_enabled Defines if the plugin will send the metrics to CloudWatch or not. Dafault “off”.
-
vmq_cloudwatch_metrics.interval The publish interval in milliseconds. Defaults to 60000(1 minute).
-
vmq_cloudwatch_metrics.namespace CloudWatch namespaces are containers for metrics. Defaults to “VerneMQ”.
-
vmq_cloudwatch_metrics.aws_access_key_id The AWS Key. See http://docs.aws.amazon.com/IAM/latest/UserGuide/id_credentials_access-keys.html.
-
vmq_cloudwatch_metrics.aws_secret_access_key The AWS secret key for connecting to CloudWatch. See http://docs.aws.amazon.com/IAM/latest/UserGuide/id_credentials_access-keys.html.
-
vmq_cloudwatch_metrics.aws_region The AWS region. Defaults to “us-east-1”.
Parameters can be defined in the vernemq.conf file.
vmq_cloudwatch_metrics.cloudwatch_enabled = on
vmq_cloudwatch_metrics.interval = 60000
vmq_cloudwatch_metrics.namespace = "VerneMQ/Dev"
vmq_cloudwatch_metrics.aws_access_key_id = "MYACCESSKEY"
vmq_cloudwatch_metrics.aws_secret_access_key = "MYSECRETACCESSKEY"
vmq_cloudwatch_metrics.aws_region = "eu-west-1"
Tip: Configuration parameters can also be changed at runtime using the vmq-admin script.
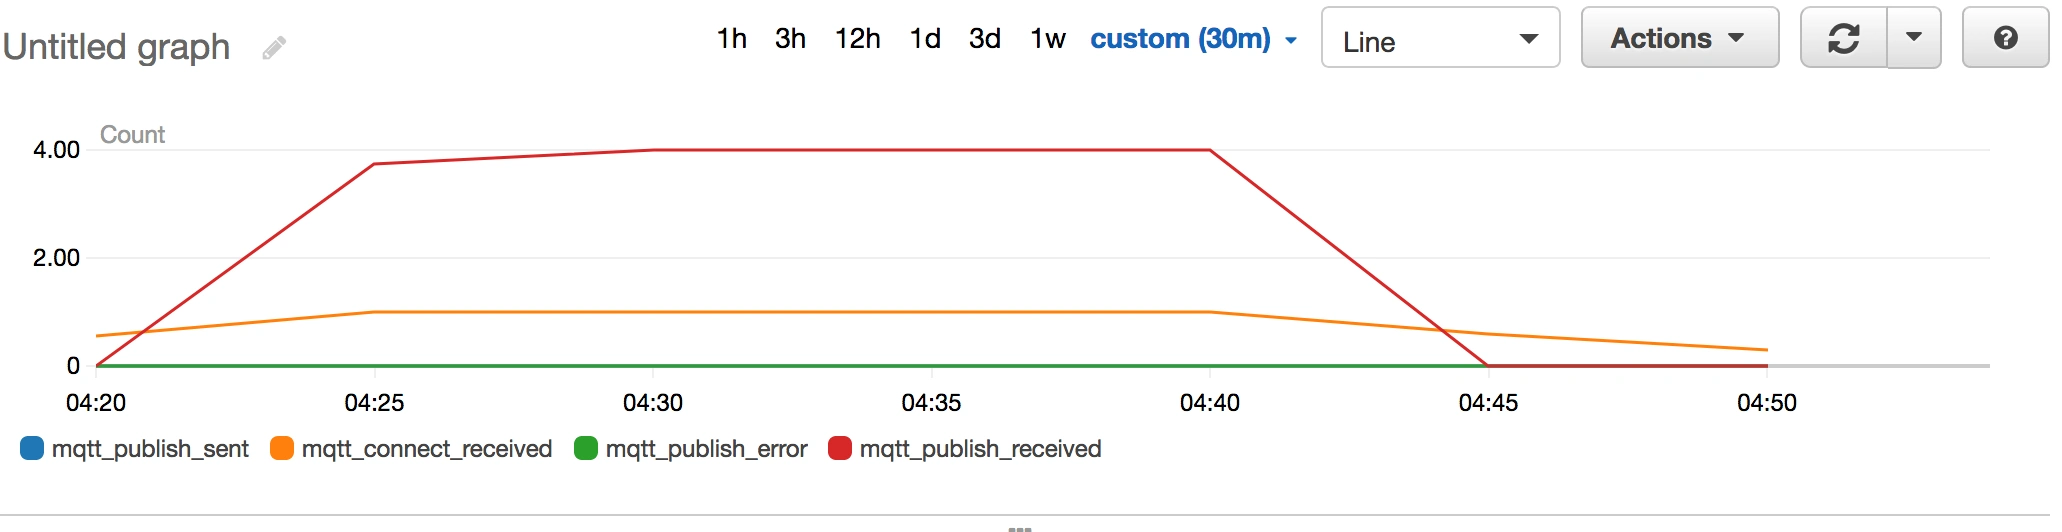
In a clustered environment, the plugin sends each node name in the cluster as a dimension. You can create a dashboard using these metrics, depending on your needs. The plugin exports all the metrics described on the VerneMQ documentation at https://vernemq.com/docs/monitoring/#exported-metrics.
Sample graph generated with the plugin
That’s it folks, hope this can be useful to somebody out there, feel free to report any bug or improvement on GitHub.